Interactive map shows exactly where Covid-19 infections are on the rise in Lancaster and Morecambe
and live on Freeview channel 276
The Lancaster district as a whole was showing new case rates in line with the national average in the week up to January 7, with a total of 705 new cases recorded, and a "rolling rate" of 482.8.
Yesterday, January 12, 110 new cases were recorded across the Lancaster district.
Advertisement
Hide AdAdvertisement
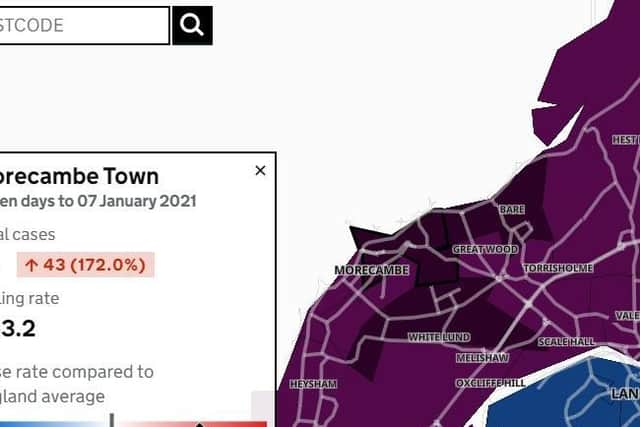
Hide AdLooking more closely at the government's interactive map, Morecambe Westgate, Morecambe Town and Bare have shown significant increases in cases per head of population.

In Westgate, there had been 66 new cases in the week up to January 7.
It recorded a "seven day rolling rate" of 982.4, which is calculated per 100,000 population.
So if 100,000 people lived there, 982.4 of them would have tested positive for Covid-19.
Advertisement
Hide AdAdvertisement
Hide AdTo put this into further perspective, this is a rate of 9.8 positive test cases in every 1,000.
The rate in Morecambe Town has also increased significantly, with 68 new positive cases recorded in the same time period, and a rolling rate of 863.2.
Bare, which was described as "suppressed" in December, had 48 new cases and a rolling rate of 916.2.
Elsewhere in the Lancaster district in the week up to January 7 (England average rolling rate - around 500 per 100,000).
Heysham and Overton - 79 new cases, rolling rate of 573.1.
Skerton and Vale - 41 new cases, rolling rate of 502.
Advertisement
Hide AdAdvertisement
Hide AdScale Hall and Torrisholme - 81 new cases, rolling rate of 673.8.
Hest Bank and Bolton-le-Sands - 36 new cases, rolling rate of 504.2.
Marsh, Haverbreaks and Scotforth West - 36 new cases, 332.6 rolling rate.
Lancaster Central - 26 new cases, 285.3 rolling rate.
Moorlands and Greaves - 11 new cases, 182.4 rolling rate.
Scotforth East and Bowerham - 29 new cases, 495.2 rolling rate.
Advertisement
Hide AdAdvertisement
Hide AdUniversity Galgate and Dolphinholme - 27 new cases, 226.5 rolling rate.
Halton and Caton - 12 new cases, 211.8 rolling rate.
Kellet and Lune Valley - 12 new cases, 189.9 rolling rate.
Carnforth, Silverdale and Warton - 37 new cases, 374.3 rolling rate.
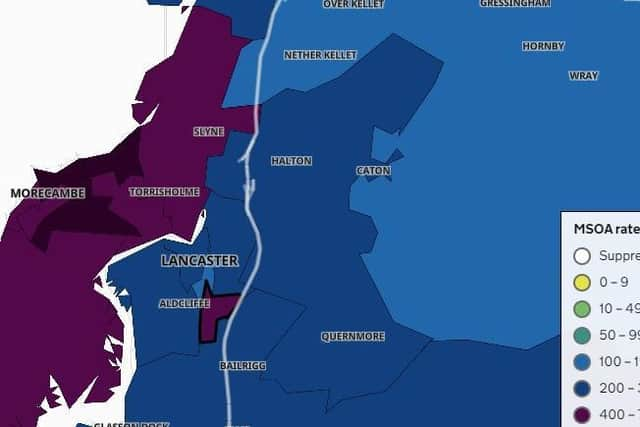
The interactive map HERE allows the public to zoom in on particular cities, towns and villages to find out exactly what is going on in their area on a weekly basis.
You can compare the figures for October 15 2020 HERE. where the rates in Lancaster compared to Morecambe differed in terms of case rates.
The Lancaster Guardian will be studying and publishing the data for the week up to January 14 when it becomes available on the government's website.
Comment Guidelines
National World encourages reader discussion on our stories. User feedback, insights and back-and-forth exchanges add a rich layer of context to reporting. Please review our Community Guidelines before commenting.